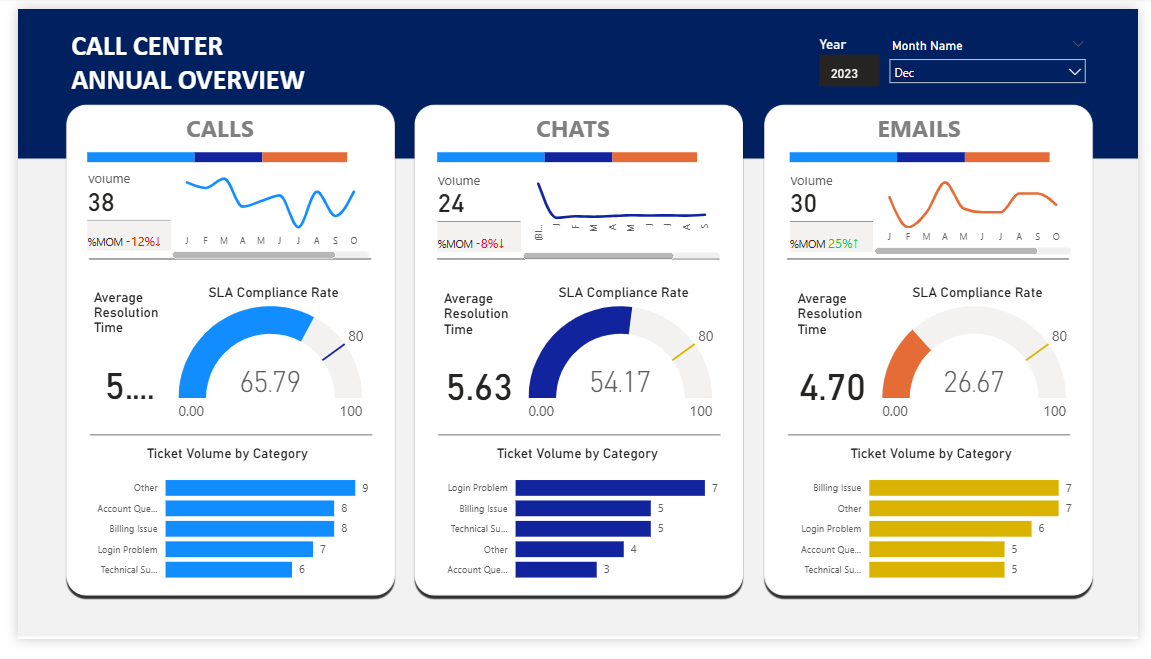
Call Center KPI's Performance Insights Power BI Dashboard
This dashboard helps managers and analysts track customer support activities across calls, chats, and emails. It enables data-driven decisions by highlighting SLA performance, resolution times, and ticket distribution by category.
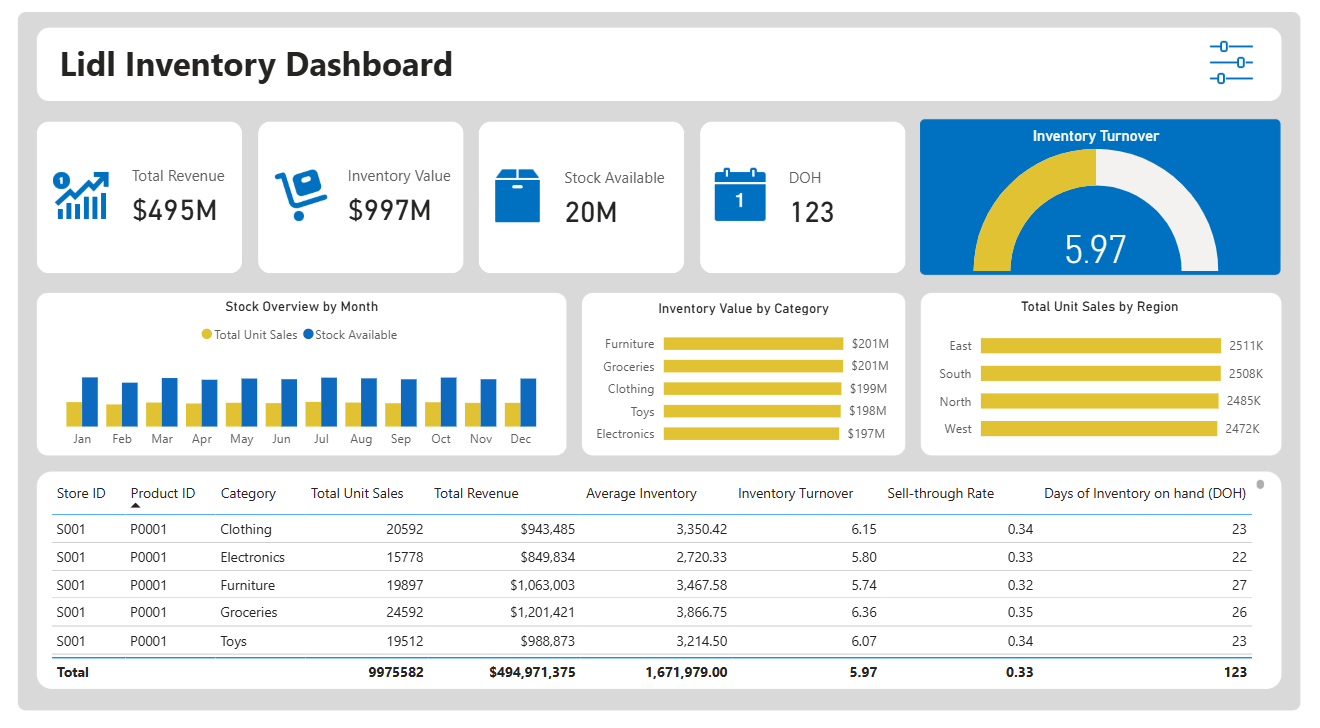
Inventory performance dashboard designed to monitor stock, sales, and turnover KPIs.
The Lidl Inventory Dashboard helps business managers monitor inventory turnover, sales performance, and stock availability across regions and product categories. It ensures better demand forecasting, reduced stockouts, and optimized supply chain efficiency.
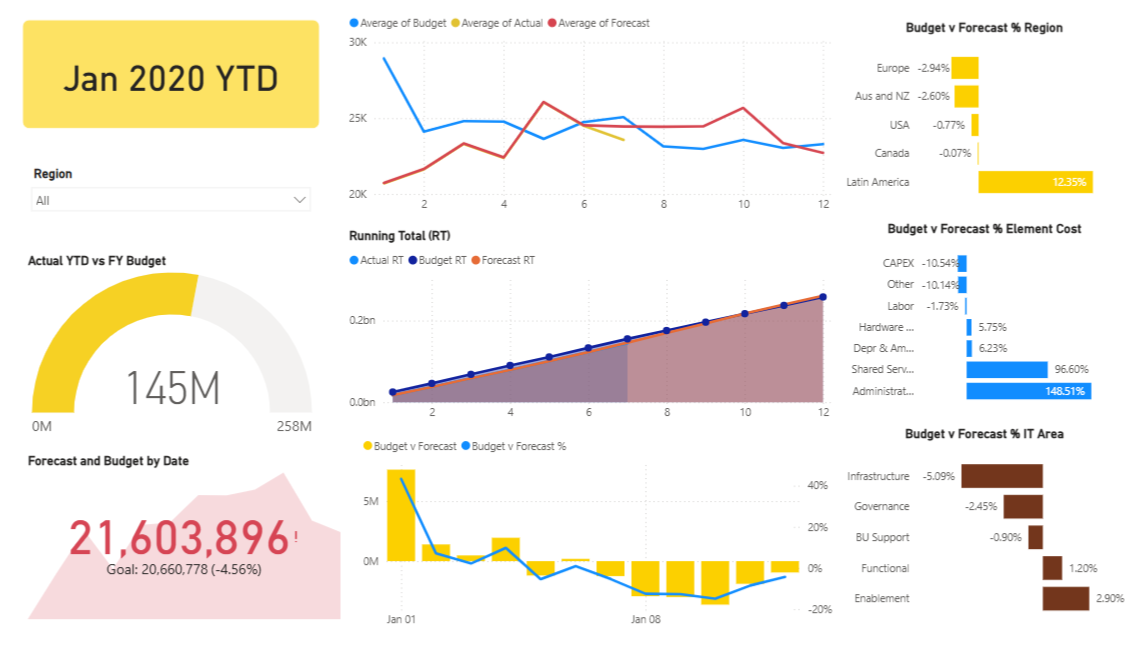
Actual vs Forecast Budget Analysis Dashboard (IT Firm – 2020 COVID Impact)
Analyzes the financial performance of an IT firm during 2020, comparing actual costs vs forecasted budgets across IT areas, cost elements, and regions. Built in the context of COVID-19 disruptions, it provides leadership with insights into budget deviations, overspending, and underutilization to support better financial planning.
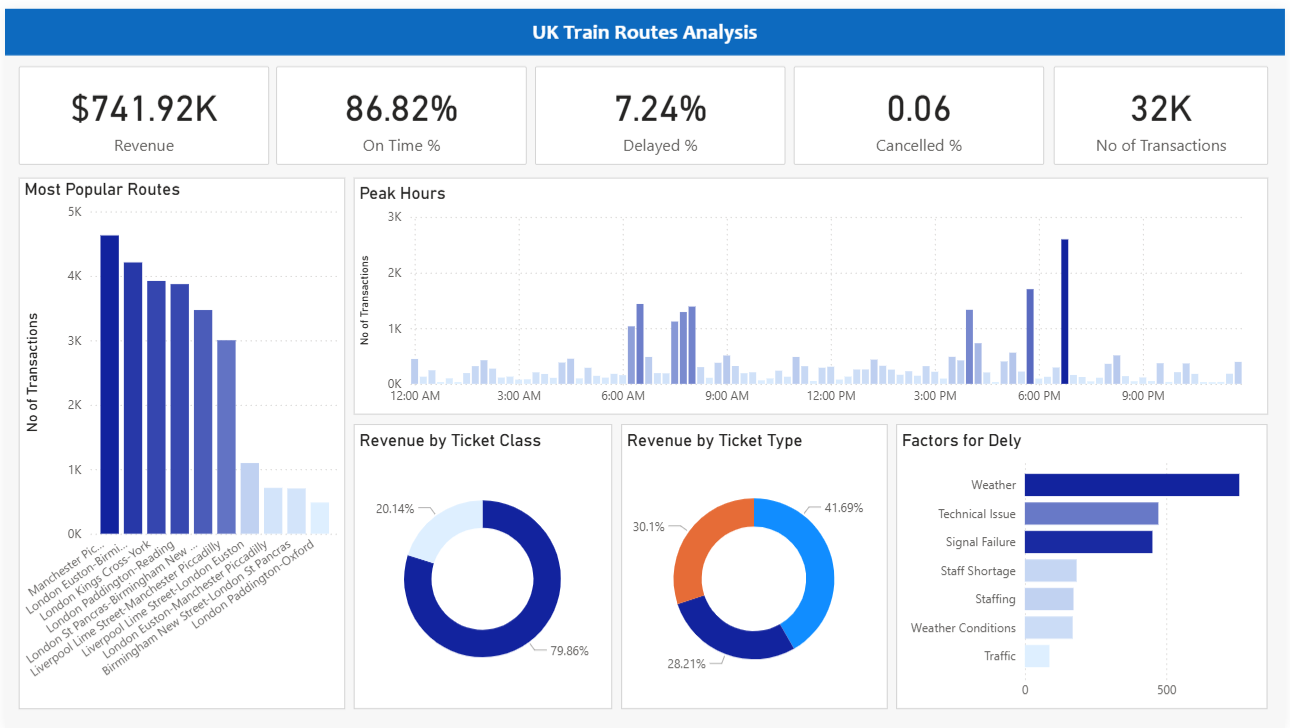
Analyzes UK National Rail ticket data (Jan – Apr 2024), containing 31,653 transactions across 18 fields. Build dashboards in Power BI that help stakeholders understand railway network usage, revenue streams, and operational performance.
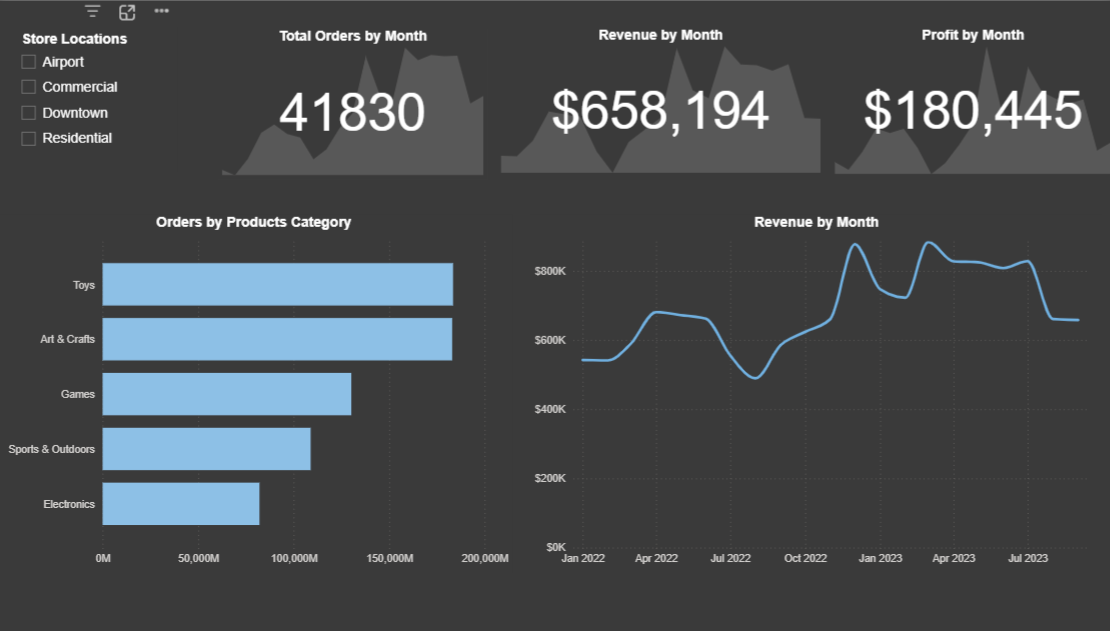
Analyzes sales and inventory data for a fictitious toy store chain in Mexico. Using the dataset provided, we built an interactive KPI dashboard to track sales performance, profitability, and product category trends across multiple store locations. The dashboard helps decision makers quickly assess revenue, profit margins, order volumes, and category performance while providing insights into inventory and regional sales distribution.
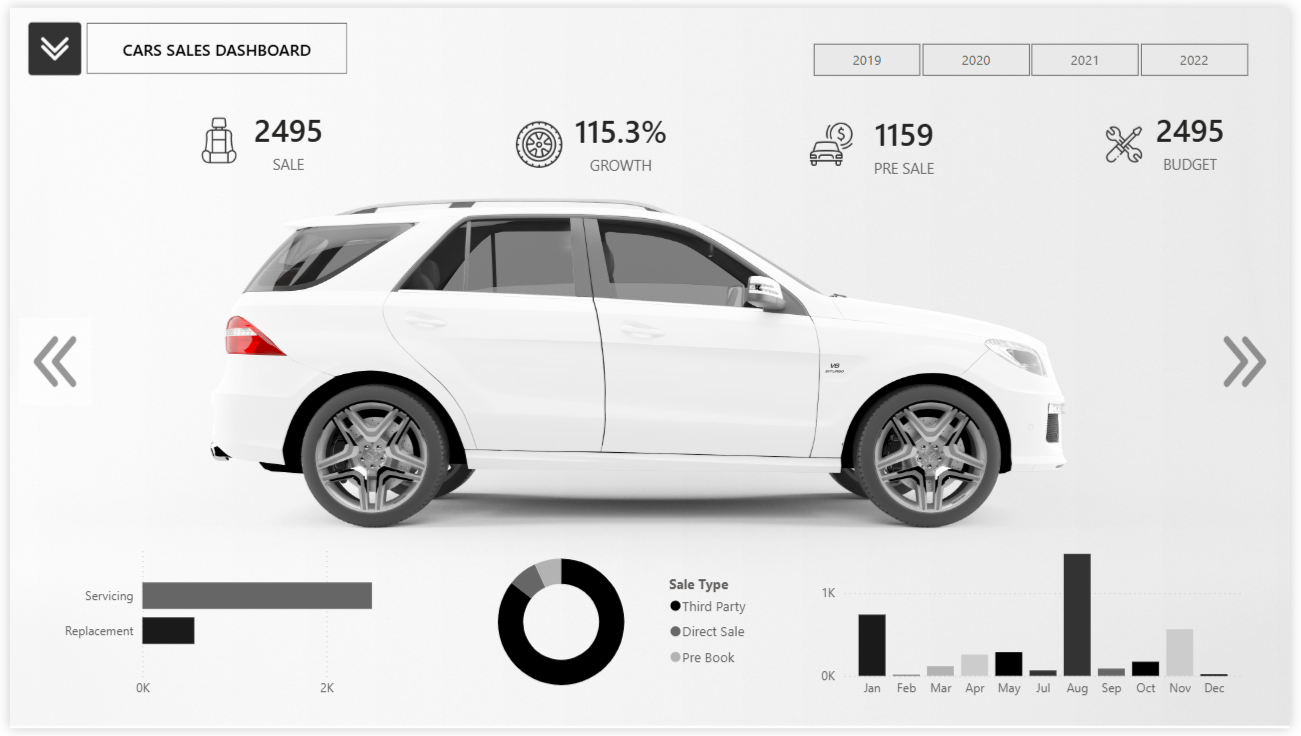
Automobile Sales Report provides a comprehensive view of sales performance, presales, and after-sales services over four years. From a business perspective, this dashboard supports strategic decision-making by identifying which models perform best, when demand is strongest, and how after-sales services contribute to long-term profitability.
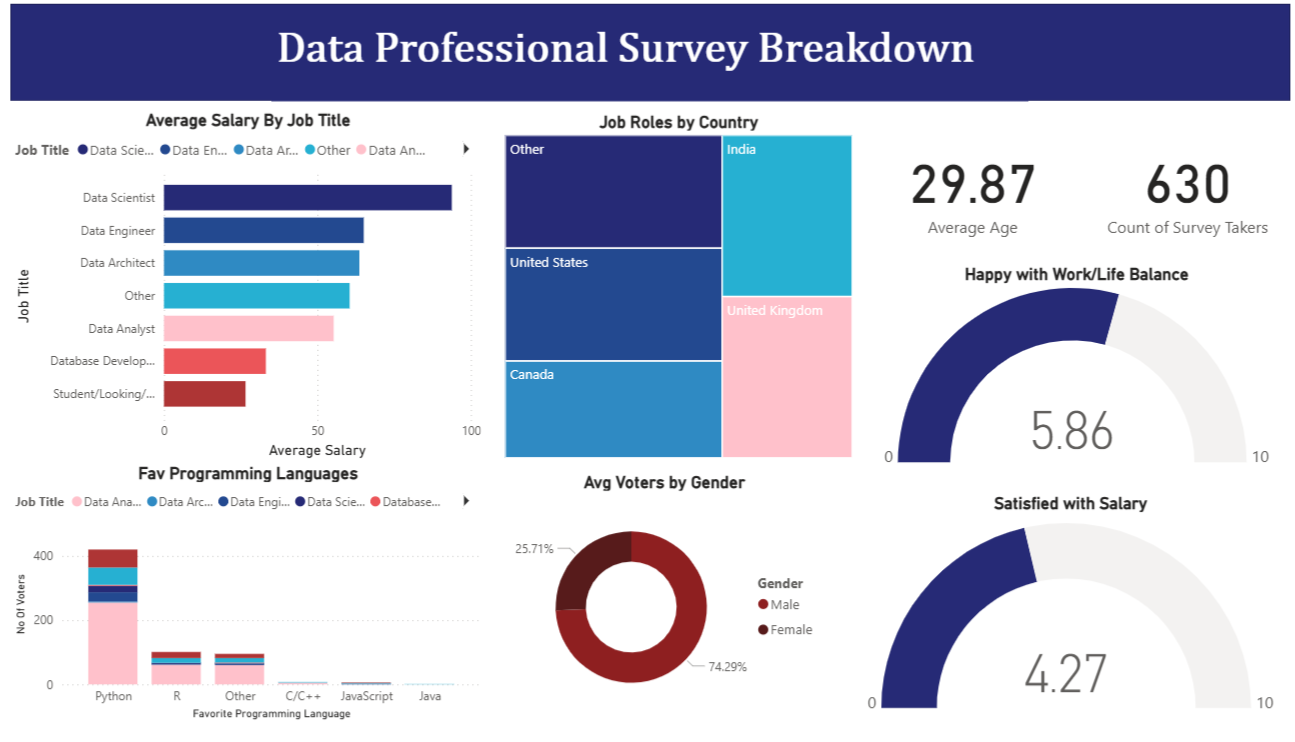
Analyzing insights from a global survey of Data Science & Analytics professionals. This report explores job roles, salaries, programming preferences, demographics, and career satisfaction in the data industry.
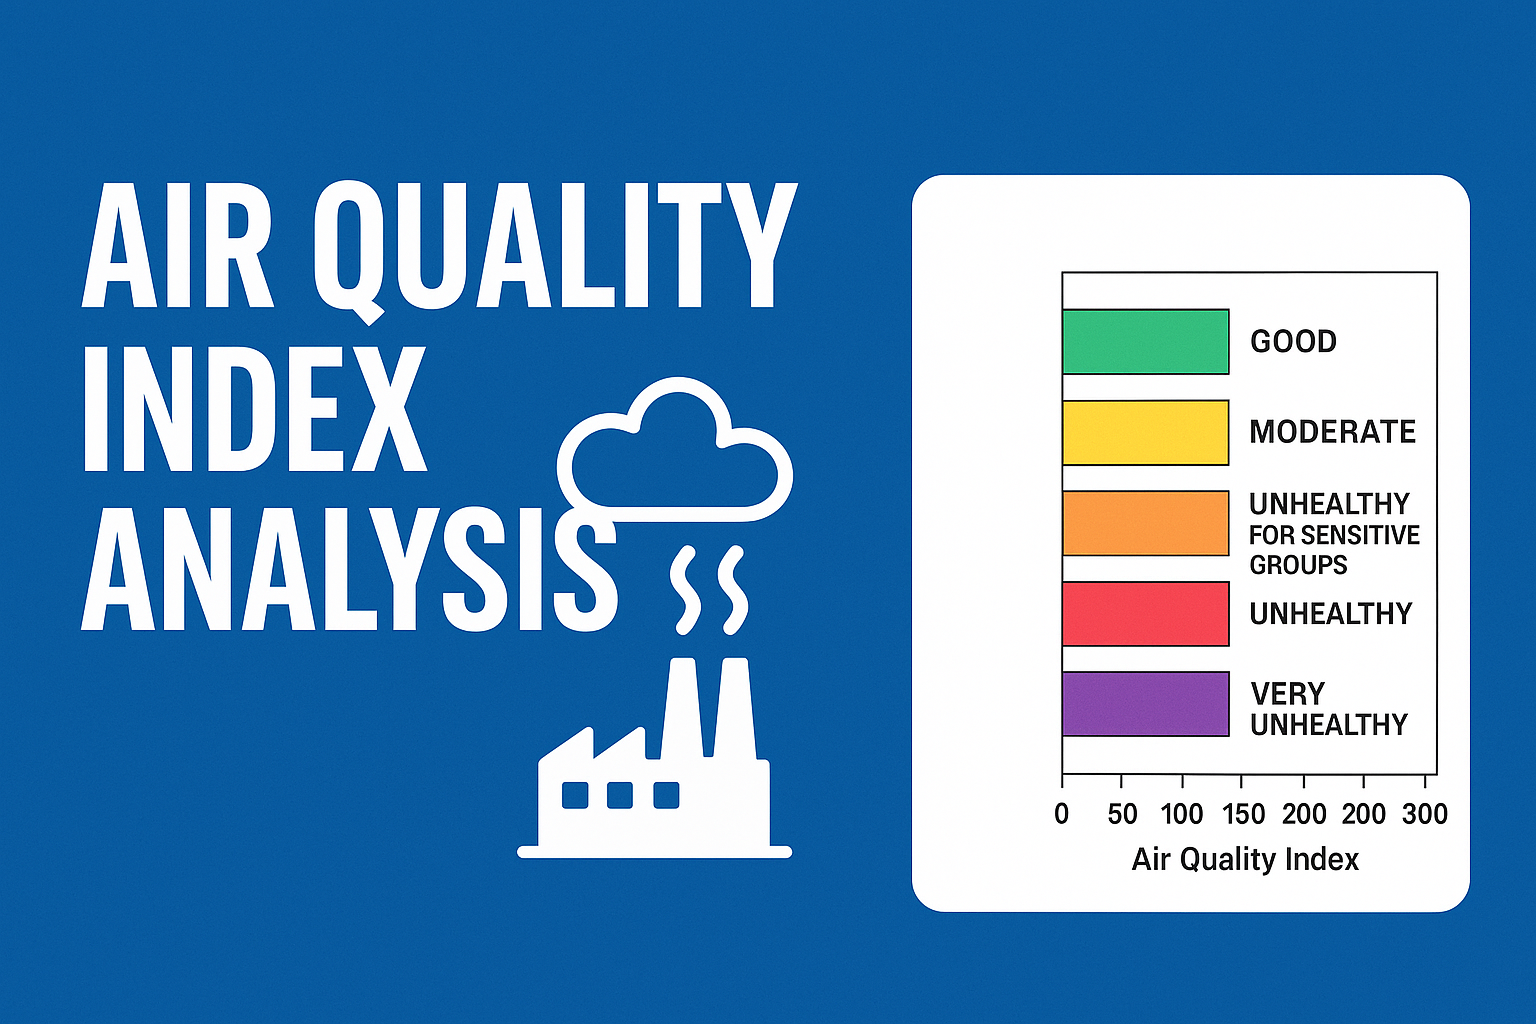
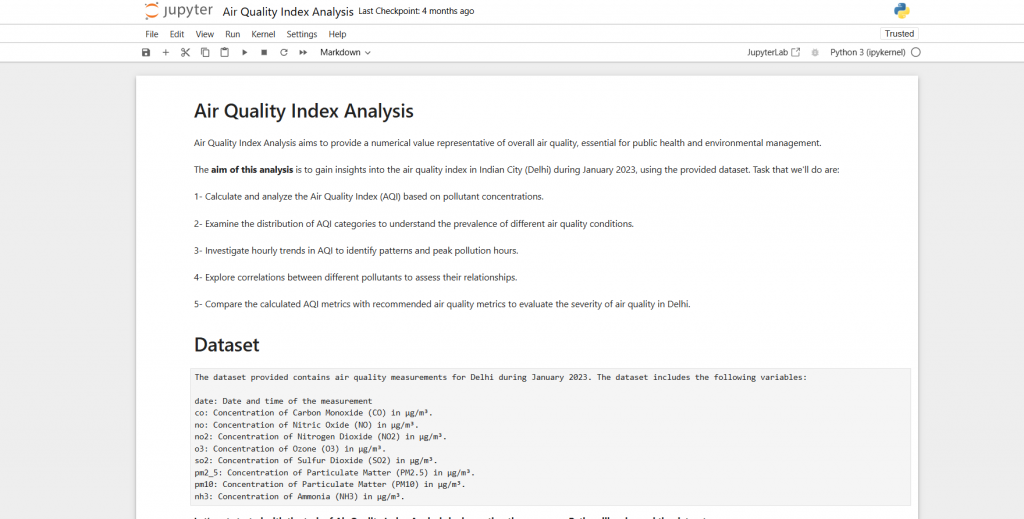
analyzes the Air Quality Index (AQI) in Delhi (January 2023) using time-series analysis, pollutant correlation, and AQI computation. The goal is to uncover pollution patterns, weekly/daily trends, and health risks associated with poor air quality.
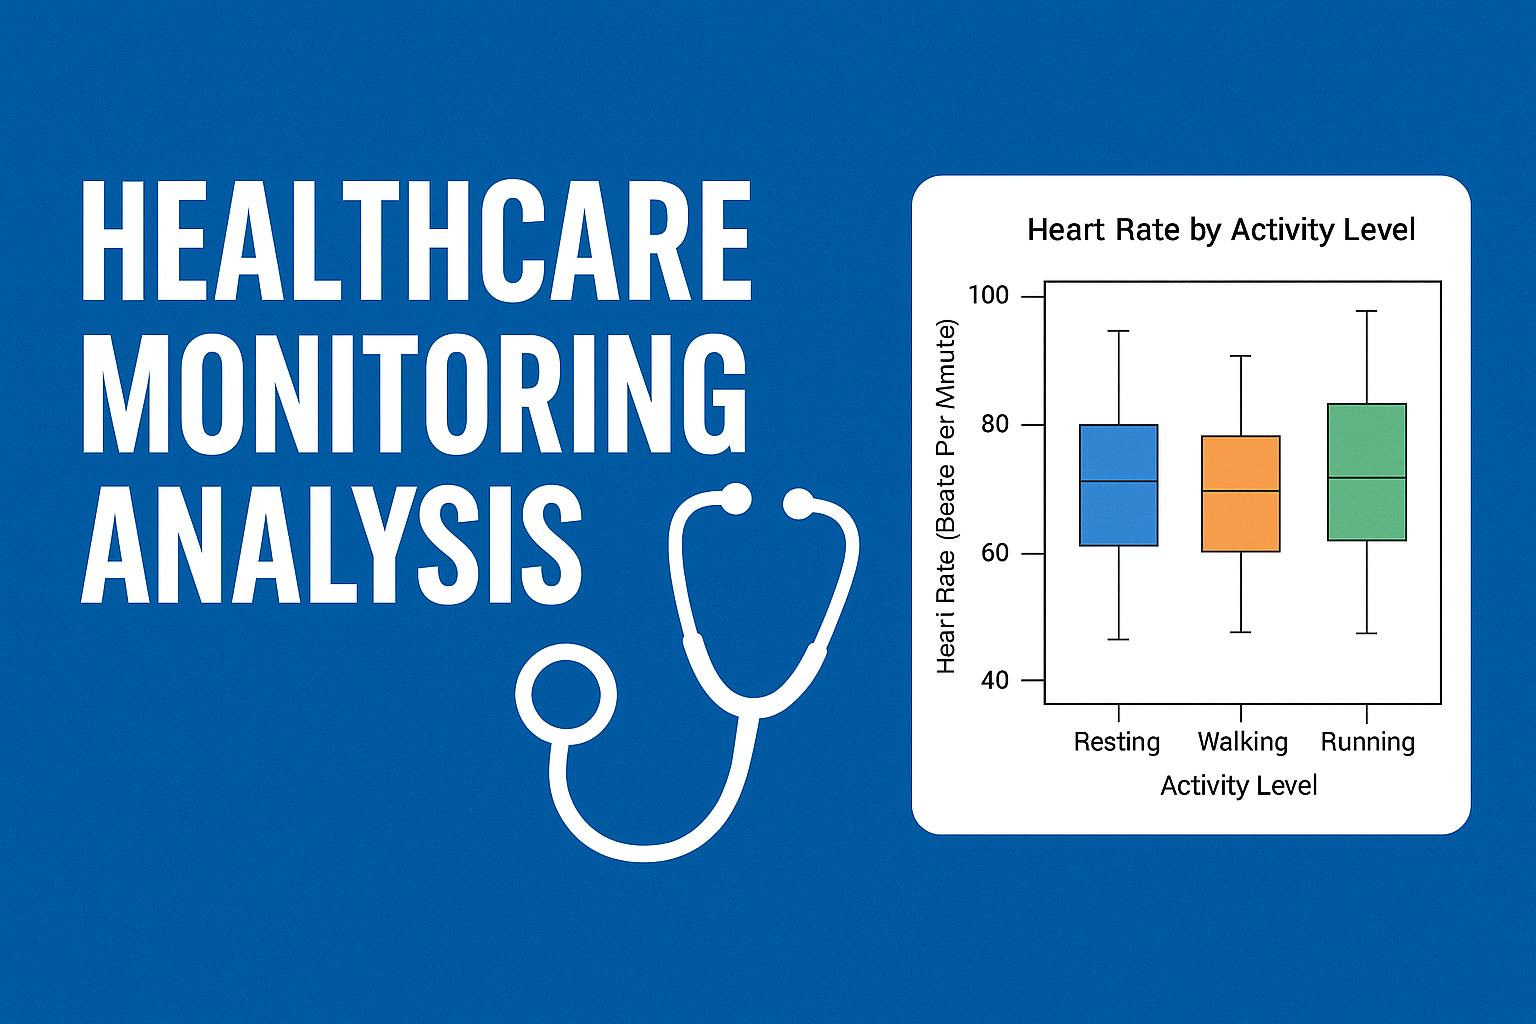
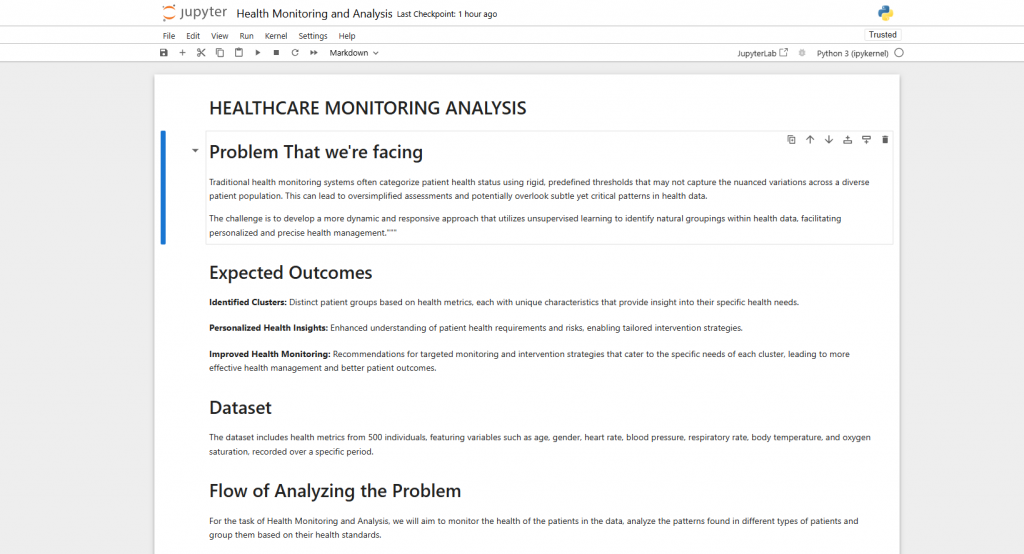
Traditional health monitoring systems often categorize patient health status using rigid, predefined thresholds that may not capture nuanced variations across a diverse patient population. The challenge is to develop a dynamic and responsive approach using unsupervised learning to identify natural groupings in health data, enabling personalized and precise health management.
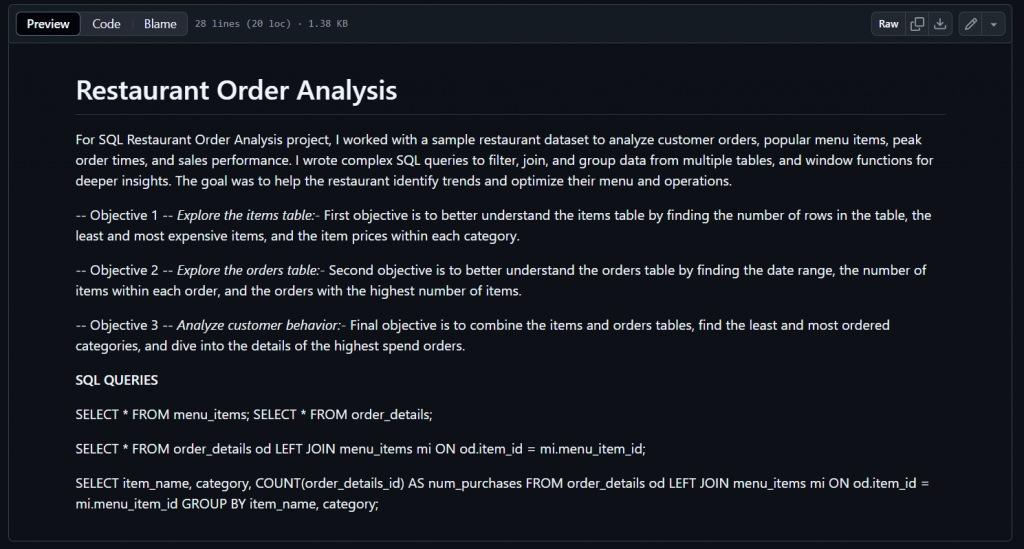
Analyzed customer orders, identified popular menu items, evaluated peak order times, and assessed overall sales performance. The goal was to use SQL to uncover patterns and trends that can guide restaurant management decisions.